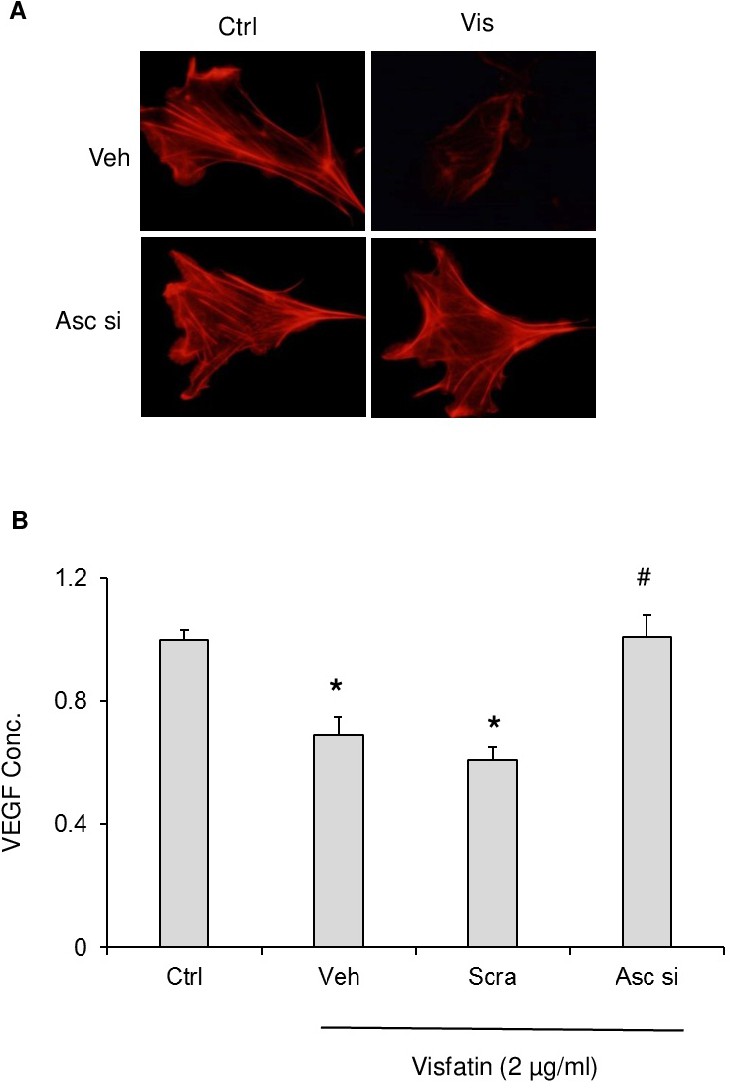
Fig. 4. Effects of silencing ASC on visfatin-induced podocyte functional changes. A. Representative microscopic images of F-actin using rhodamine-phalloidin staining (Original magnification, ×400). B. Summarized data showing the fold change of VEGF levels in podocytes with or without visfatin and/or Asc siRNA treatment. N=5 each group. Ctrl: Control, * Significant difference (P<0.05) compared to the control group; # Significant difference (P<0.05) compared to the visfatin (vehicle) group.